
Quarterly Market Outlook
Q3 2026
Author

Chief Investment Officer
Key Themes
- Private Credit Positioned Better than the Headlines
- Late Cycle, Long Runway
- Policy Tailwinds, Selective Credit
- Stimulus Suppressing the Cycle
We are encouraged by how well both the economy and private credit markets have held up amid an environment dominated by cautious headlines. Entering the year, there were legitimate concerns that higher rates, tighter financial conditions, and isolated pockets of credit stress would lead to a broader deterioration in fundamentals. Instead, the data has generally moved in the opposite direction.
GDP growth remains solid. Labor market dynamics are nuanced: hiring has moderated, and labor force participation is declining, but the deterioration in job openings has arrested. We are not seeing the kind of broad softening that historically precedes recession. Rather, the system appears to be finding a post-COVID equilibrium — one defined by slower but durable growth.
The policy backdrop deserves more credit than markets are giving it. The One Big Beautiful Budget Act represents a substantial injection of fiscal impulse into an economy that is already on reasonably firm footing. Its effects are being felt across multiple dimensions: slowing labor market deterioration, supporting forward consumer wellbeing, and providing a buffer against the more adverse tail scenarios that credit markets have been pricing in.
The AI investment super cycle adds a further dimension. Capital expenditure tied to AI infrastructure — data centers, power, connectivity — is driving a wave of GDP contribution and debt issuance that extends the productive expansion well beyond traditional cycle drivers.
Credit fundamentals have held up better than the bearish consensus anticipated. Delinquencies are down across the board. Covenant default rates and leverage metrics have ticked modestly lower. Commercial banks are beginning to redeploy capital — a constructive signal that confidence in the underlying credit environment is recovering.
On PIK trends, the picture has improved. “Bad PIK” — the kind that reflects borrower distress rather than structured preference — has been declining since late 2025. That said, loan-to-value ratios have been creeping higher across parts of the market, and we are monitoring LTV expansion as a potential leading indicator of future pressure.
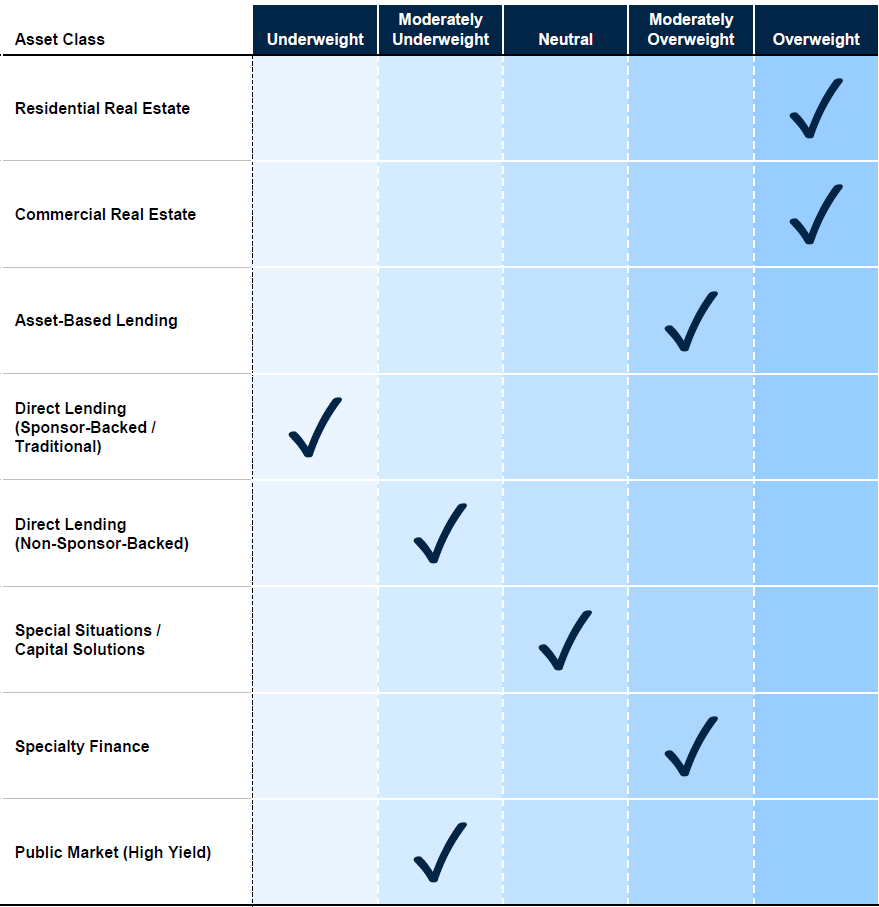
Against this backdrop, we remain constructive on asset-based lending and real estate credit. These segments benefit directly from the policy and macro dynamics described above — hard asset collateral, floating rate exposure, and structures that are inherently senior in the capital stack.
We continue to be cautious on direct lending broadly. Spread compression, elevated leverage in parts of the market, and the software sector softness give us pause. The risk/return profile in direct lending is less compelling today than it was two years ago, and selectivity is imperative.
Heading into the back half of the year our posture is one of disciplined optimism: macro landscape is better than feared, the policy environment is supportive, and the best opportunities lie in secured, asset-backed structures over unsecured cash flow lending.

Real Estate Lending

Asset-Based Lending

Corporate Lending
- Stabilizing supply-demand dynamics and accelerating transaction volumes have created a prime window for bridge lending. As price discovery solidifies, we are targeting select high-growth markets where risk-adjusted returns are increasingly attractive and fundamental stabilization is imminent.
- We are harvesting premium yields by filling the financing gap left by defensive traditional banks, providing flexible bridge and value-add capital to high-quality developers in a less crowded lending environment.
- The attractiveness of ABL continues to compound with the “spread migration” away from Corporate Lending. Collateralized, short-duration, amortizing loan structures that are the hallmark of asset-based lending are seeing robust demand from investors looking to diversify risks and maintain high income streams.
- Litigation finance, regulatory capital relief and small business financing continue to offer, in our view, some of the most attractive risk-adjusted returns. These specialties are especially attractive when juxtaposed against the continued softening in consumer-facing sectors like credit cards and auto finance.
- While macro volatility has caused a 25-50bps spread widening in corporate debt, spreads remain historically tight, particularly within the core middle market.
- The divergence between SaaS and non-SaaS companies remains, and within tech-focused firms there has been a bifurcation between the top-tier names with healthy balance sheets and cash flows vis-à-vis rest of the SaaS market.
- Overall, the fundamental health of the asset class is best evidenced by non-accrual rates, which remain contained at ~1.0% through Q1 2026 across the industry’s largest BDCs.
The views expressed in this chart are those of the Investment Team of Nomura Capital Management LLC and are based on the Investment Team’s forward-looking assessment of credit markets as of the date referenced above. The views expressed herein are subject to change at any time following the publication of this report. The arrows in the chart reflect the change in the Investment Team’s outlook of each credit market since its prior quarterly market commentary. This chart is provided for informational purposes only and is not intended to represent a recommendation from Nomura Capital Management LLC to invest in, or divest from, the credit market asset classes referenced herein.
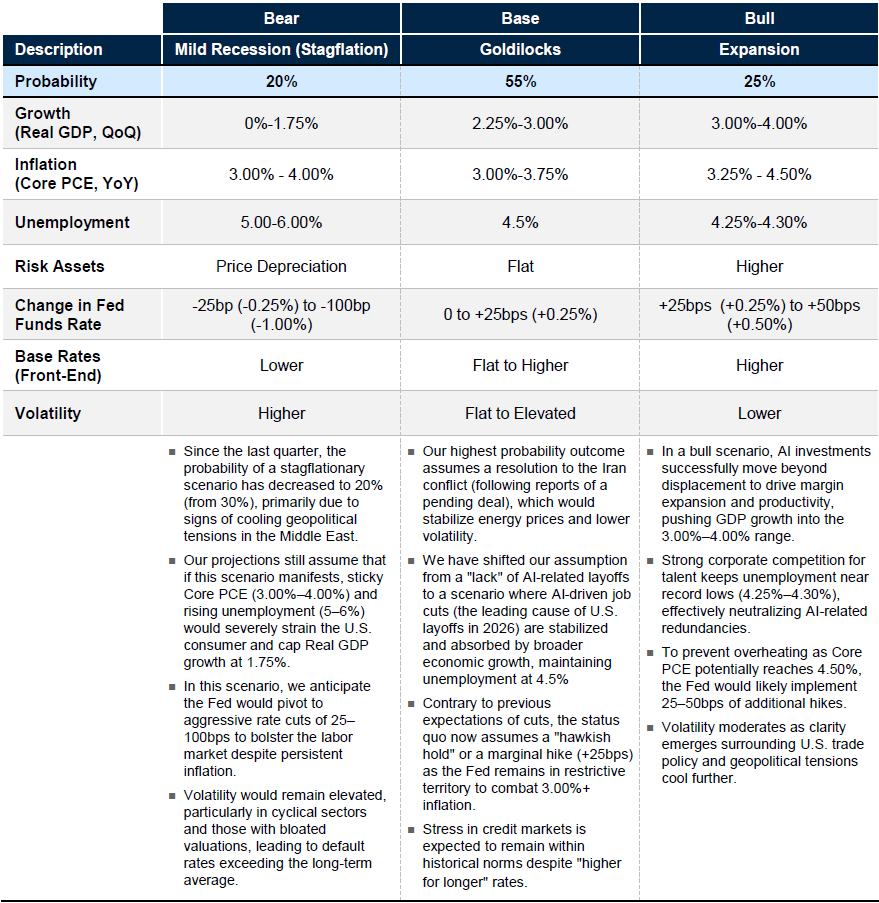
The views expressed in this chart are those of the Investment Team of Nomura Capital Management LLC and are based on the Investment Team’s forward-looking assessment of the general macroeconomic environment as of the date of this report. The Bull/Base/Bear Market (“Market Scenarios”) outcome probabilities noted in this report reflect the Investment Team’s forward-looking estimate of the probability of each Market Scenario occurring within the next 12-18 months from the date of this report. The market metrics noted within this report (Growth, Inflation, Unemployment, Risk Assets, Base Rates and Volatility) represent the Investment Team’s forward-looking estimate of each market metric resulting from the corresponding Market Scenario. All views and estimates contained within this report are as of the date of this report and are subject to change at any time following the publication of this report.
Healthy Leverage Levels in Corporate Sectors
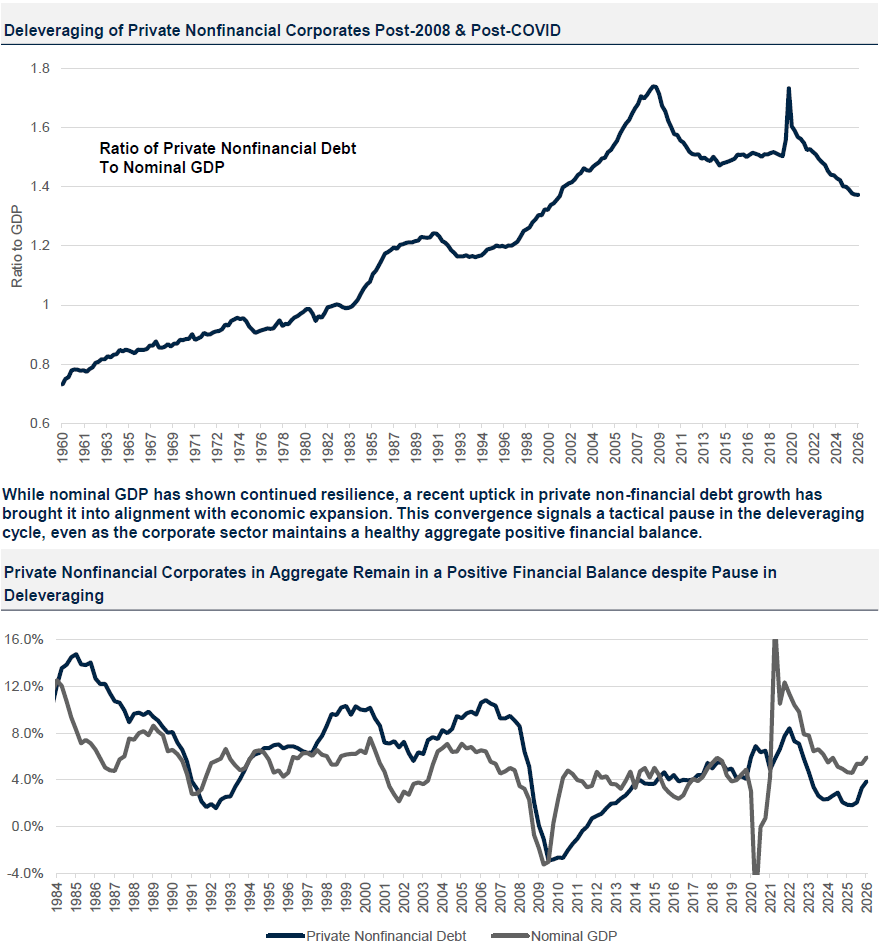
Data from Federal Reserve
Improving Credit Metrics: Contrary to bearish expectations
Despite mixed sentiment, Private Credit fundamentals remain strong. Stable Q1 2026 covenant default rates (3.1%) reflect disciplined underwriting, while the 8% rise in amendment activity highlights the asset class’s key advantage: structural flexibility.
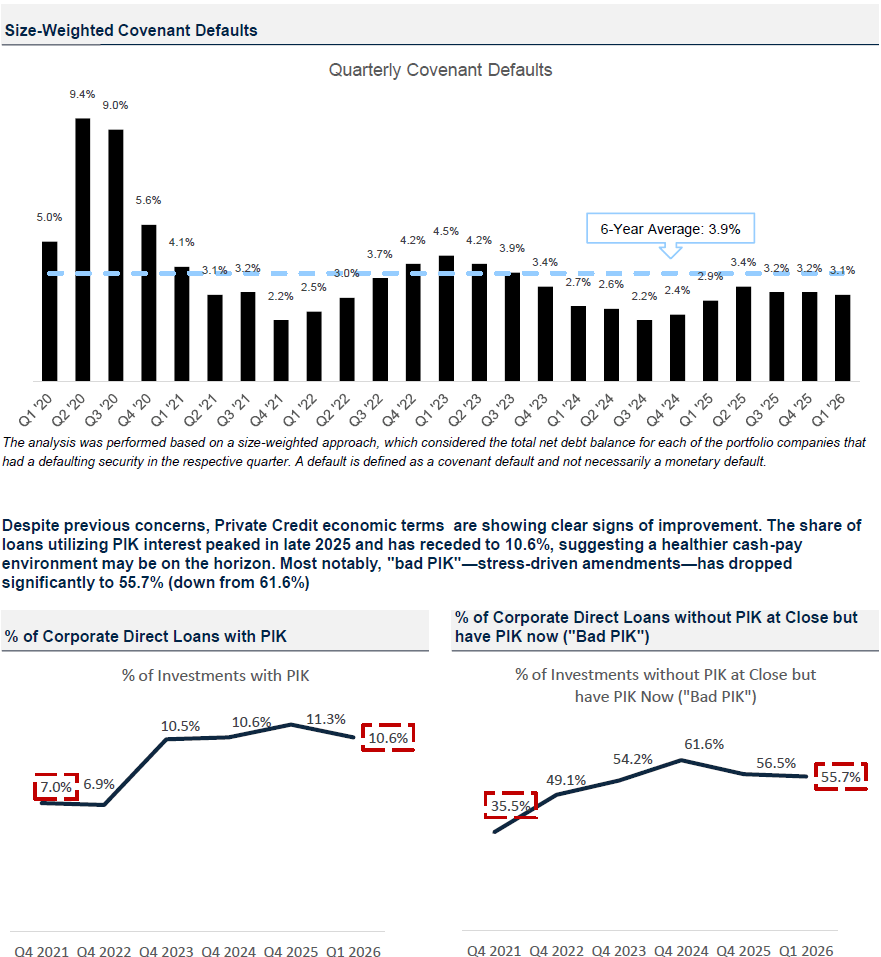
Data from Lincoln International
Rapid Rise of Asset-Based Lending & Specialty Finance
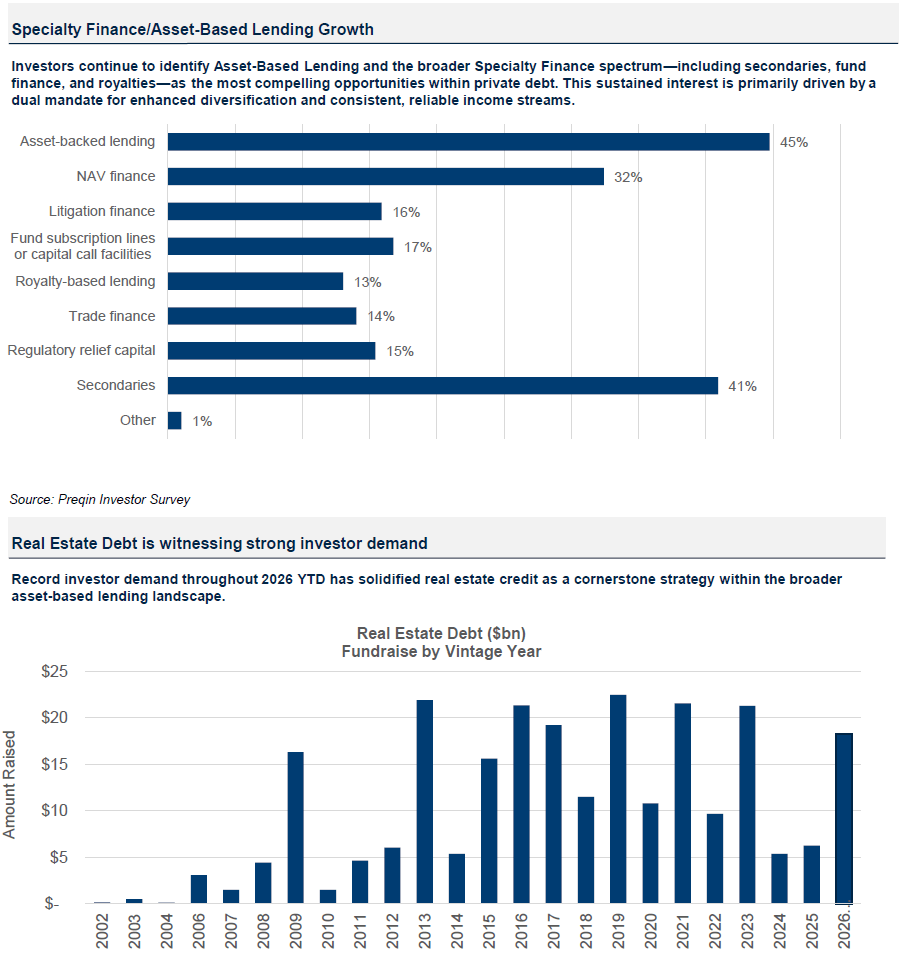
Data Sourced from Bloomberg
Normalizing Supply and Rising Transaction Volumes Drive Commercial Real Estate (CRE) Momentum
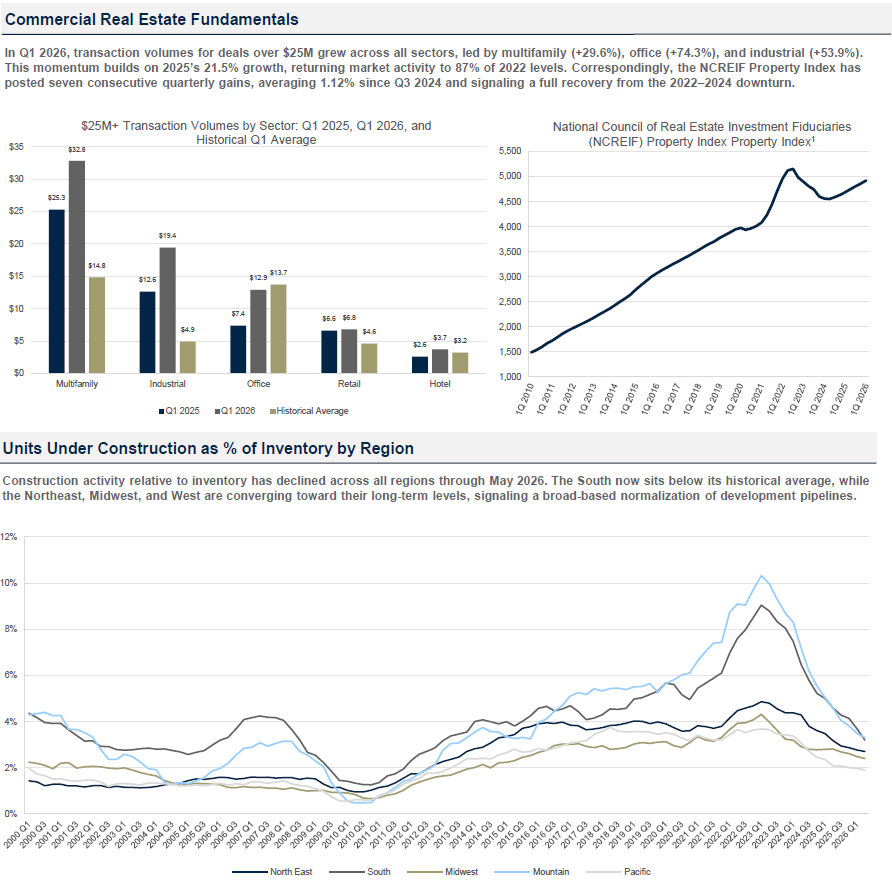
Data sourced from Bloomberg, CoStar, Green Street
- The NCREIF Property Index (NPI) is a quarterly, unleveraged composite total return for private commercial real estate properties held for investment purposes only. All properties in the NPI have been acquired, at least in part, on behalf of tax-exempt institutional investors and held in a fiduciary environment
Housing Market Conditions Continue to Normalize
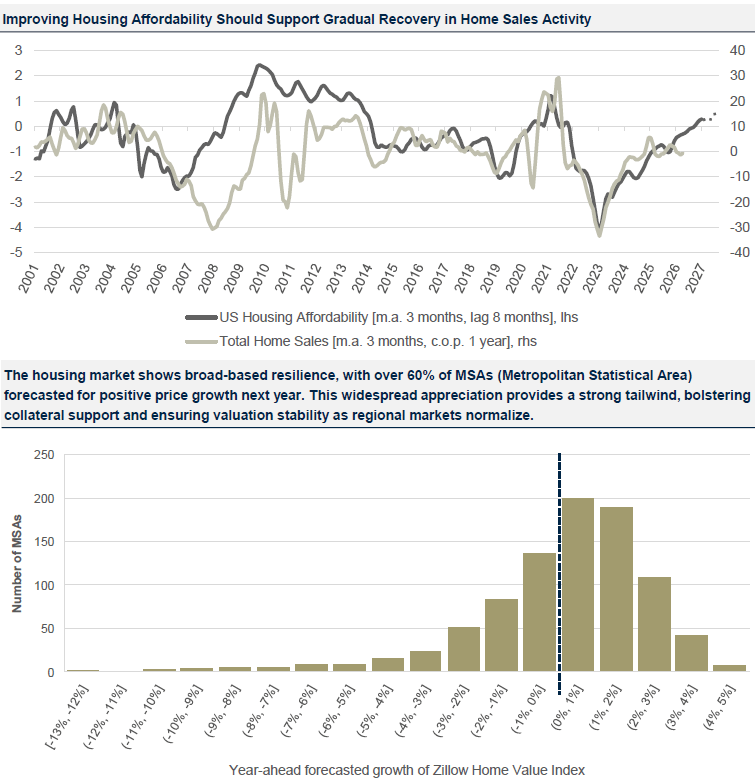
Source: Nomura Asset Management International, Macrobond, National Association of Realtors (NAR), U.S. Census Bureau, Bankrate, U.S. Bureau of Economic Analysis (BEA), Freddie Mac, S&P Global, U.S. Bureau of Labor Statistics (BLS), National Association of Home Builders, Zillow
Resilient Macro Outlook and “Mid-to-Late-Stage” Positioning:
Credit Markets & Default Performance
What we still like:
 Asset-based lending: Loans collateralized by non-real-estate physical assets such as equipment, infrastructure, or inventory.Residential real estate: Home equity loans, residential transition loans and other home loan products in high home price appreciation (HPA) geographies backed by healthy levels of borrower equity.Commercial real estate: Short-duration bridge and gap loans for multifamily, student housing, and warehouses.Specialty finance: Cash flows backed by diversified packages of consumer / small-and-medium sized enterprise (SME) loans, intellectual property, and royalties.
What we don’t like:
 Corporate credit: Cyclical tights in corporate credit spreads makes their risk/reward profile asymmetric and highly primed for market volatility.
This is for informational purposes only and is not intended to represent a recommendation from Nomura Capital Management LLC to invest in, or divest from, the credit market asset classes or security types referenced herein.
These materials reflect the opinion of NCM on the date of production. Opinions and statements of financial market trends that are based on current market conditions constitute our judgement and are subject to change without notice. Past performance does not guarantee future results. Where data is presented that is prepared by third parties, such information will be cited, and these sources have been deemed to be reliable. However, NCM does not independently verify or otherwise warrant the accuracy of this information. All investments are subject to risks, including the risk of loss of principal.