
The Rise of Asset-Based Lending
Published on September 2024
I. Introduction to Asset-Based Lending
Asset-Based Lending is a type of financing collateralized by a specific pool of cash flowing assets that serve as the primary form of repayment to the lender.
Typical asset types used as collateral in Asset-Based Lending transactions:
- Residential Mortgage Loans
- Commercial Mortgage Loans
- Real Estate Loans
- Home Equity Lines of Credit
- Mortgage Servicing Rights
- Residential Transition Loans
- Single Family Rentals
- Timeshare
- Auto Loans/Leases
- Credit Card Receivables
- Marketplace Loans
- Personal Loans
- Point-of-Sale Loans
- Solar Loans
- Student Loans
- Equipment Leasing
- Aircraft
- Shipping Containers
- Corporate Loans
- Small Business Loans
- Account Receivables
- Floorplan
- Tax Receivables
- Whole Business
- Cell Towers
- Data Centers
- Royalties (Music, Drug)
- Structured Settlements
Gaining Exposure to Private Asset-Based Lending:
There are a variety of ways to gain exposure to private ABL with varying risk-return profiles via diversified private funds, interval funds, closed-end funds, and other private credit vehicles (e.g. single transaction special purpose vehicles (“SPVs”), private securitizations). Before being bundled into a pool of assets, the loans are issued as whole, un-tranched components.

How are Private Asset-Based Lending transactions different from Public Asset-Backed Securities?
Whether investors choose to participate in private or public asset-based transactions, the structures are typically the same where one entity holds all the loans (assets) that are solely encumbered by the liabilities issued against them (e.g. notes, warehouse debt, direct facilities).
- The public securitization market is a well-oiled machine with a standard process in place when a lender comes to market to sell loans. Structural protections have become tighter and stronger over time given all the data available and increased regulatory scrutiny.
- The private market is more open ended and allows investors to structure bespoke, more customized transactions. These transactions typically share similar structural features to the public markets (including collateral eligibility, performance triggers, and investor rights).
How does ABL work?
Programmatically originating and selling loans allows lenders the opportunity to have stable capital partners to fund their loans, efficiently secure financing with low cost of funds, and collect profits on the sale of loans.
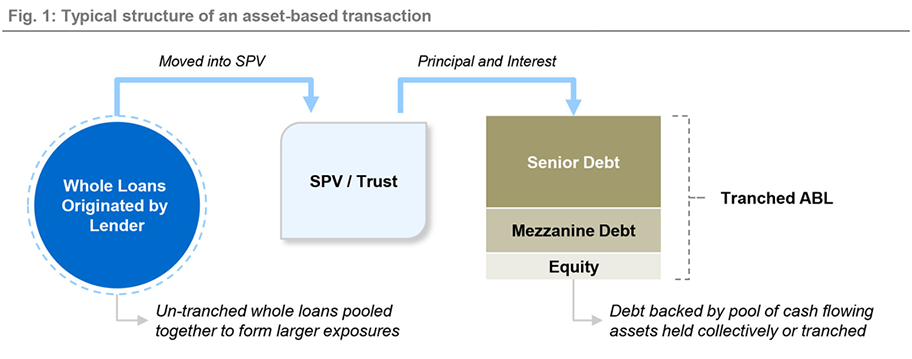
Lenders that choose to sell their loans typically place them into SPVs or trusts.
- Placing loans in trusts or SPVs allows lenders to more efficiently sell those loans to third party investors.
- These SPVs are usually bankruptcy-remote, thus detaching the risk of creditors tapping the loans for recovery in the event the lender goes bankrupt.
Loans in SPVs can be financed either via public or private markets.
- In public markets, lenders typically seek to finance individual static pools of loans through multiple investors. A bank usually steps in to arrange these securitizations.
- In private markets, investors have more control over the loans that go into the SPVs, the financing, and the partnership with other investors.
All principal and interest cash flows generated by the underlying loans in the SPVs go to pay investors according to a prescribed waterfall.
- Investors in the SPV are secured by all loans in it (including all cash flows generated by the loans).
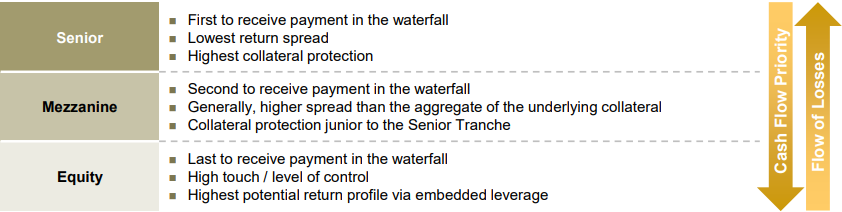
Within tranched ABL, private credit managers can take specific positions in the capital stack:
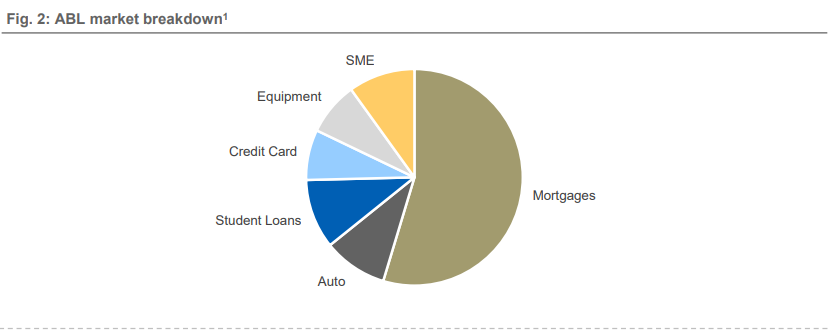
We estimate the size of the Private Asset-Based Lending market to be approaching $15 trillion based on the categories below. The largest market is the private mortgage market which we estimate to be almost $8 trillion, split into ~$5 trillion residential and nearly $3 trillion commercial. There are several asset classes within the private Asset-Based Lending market that are each over $1 trillion in size and growing such as autos, small business, equipment, and credit cards.
Why is private ABL a growing financial product within private credit?
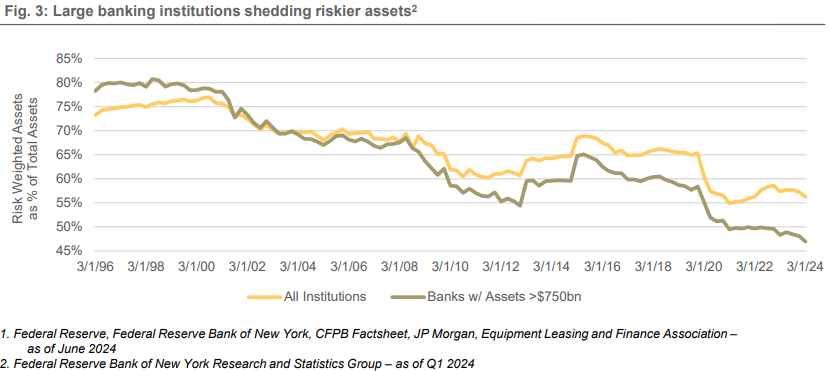
Retrenchment in bank lending and reduced appetite for risky assets have been driven by two recent
developments: (1) the liquidity pressure and asset impairment resulting from the Fed’s aggressive tightening campaign beginning in early 2022, and (2) the proposed stricter regulatory guidelines related to capital treatment of bank assets (Fig. 3). Private lenders are stepping in to fill the financing gap – particularly for small-to-medium sized commercial borrowers and consumers. Consumers and corporate borrowers that are unable to acquire traditional forms of capital have increasingly turned to asset-based lenders, utilizing their assets rather than their credit ratings and cash flows to secure financing.
II. Asset-Based Lending vs. Other Asset Classes
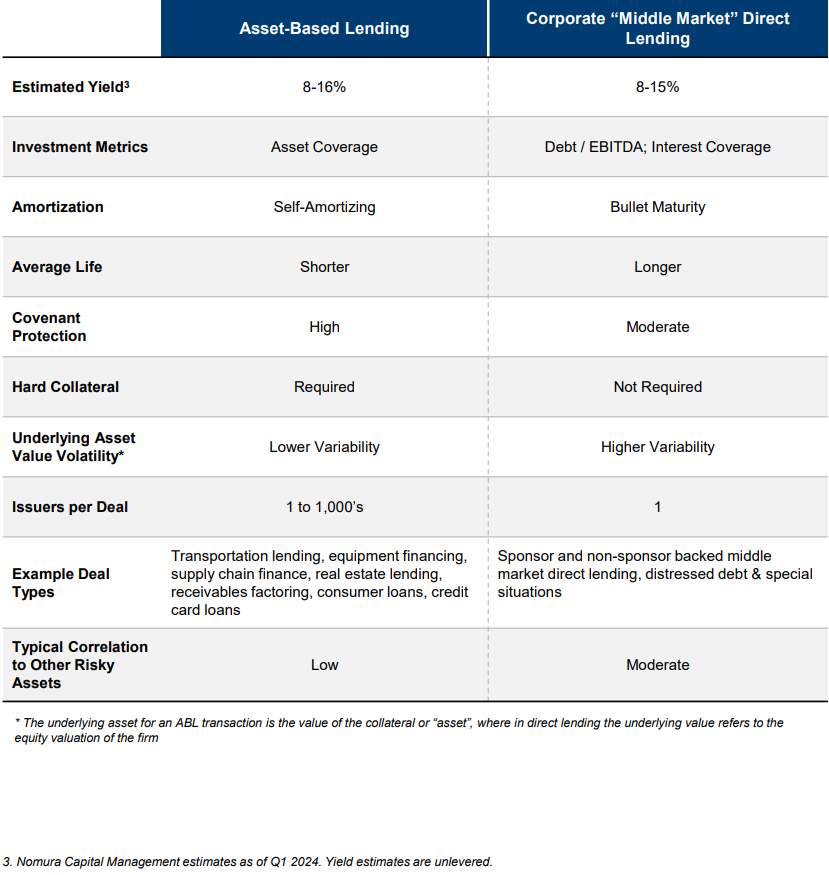
How is ABL different from Corporate “Middle Market” Direct Lending?
When comparing Asset-Based Lending to Corporate “Middle Market” Direct Lending, ABL has a markedly different profile across a number of metrics, leading to significant potential for diversification benefits within a portfolio allocating to Private Credit.
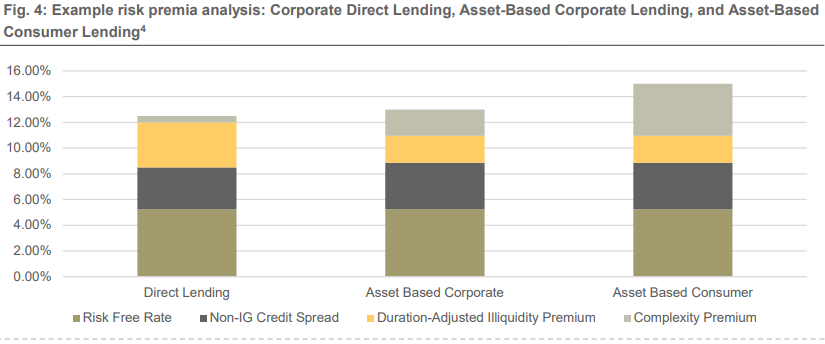
What drives the yield profile earned in ABL and direct lending?
The risk premium earned within these private credit asset classes can be broken down into several components – where part of the yield is driven by: (1) base rates, (2) credit spread similar to public market equivalents, (3) illiquidity premium commensurate with the duration of the asset (the longer the asset, the more illiquidity premium), and (4) an idiosyncratic or complexity premium.
For ABL, the complexity or idiosyncratic portion of this risk premium tends to be higher than what is seen in corporate direct lending due to nuances related to deal structure, collateral idiosyncrasies, or “esoteric” sector exposure. Direct Lending tends to be more well understood and widely accepted with respect to structure and collateral.
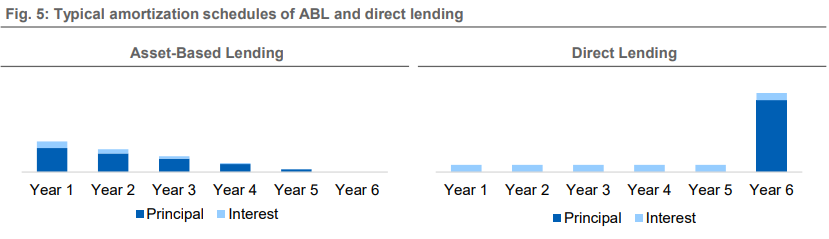
How does the payment schedule differ between ABL and direct lending?
Direct lending deals are typically structured with a 5–7-year bullet maturity, meaning investors should expect to receive periodic interest payments and a lump sum principal payment at maturity. Asset-based loans are generally structured with amortization payments linked to the gradual pay down of their underlying collateral. Investors would therefore receive a combination of periodic interest and principal throughout the life of the investment, protecting them from interest rate risk by lowering the duration of the asset. These two types of amortization schedules are visualized in Fig. 5.
- Data sourced from Morningstar LSTA US Leveraged Loan Index, Private Debt: Yield, Safety and the Emergence of Alternative Lending, by Stephen Nesbitt, Chapter 7, High Yield Bond projected IRRs based on JPM June 26, 2024 JPM USH YY TW (7.84%) and Nomura Capital Management.
Non-IG = Non-investment grade bond, considered a low quality investment because the issuer may default.
III. Potential Benefits of Diversification via Asset-Based Lending
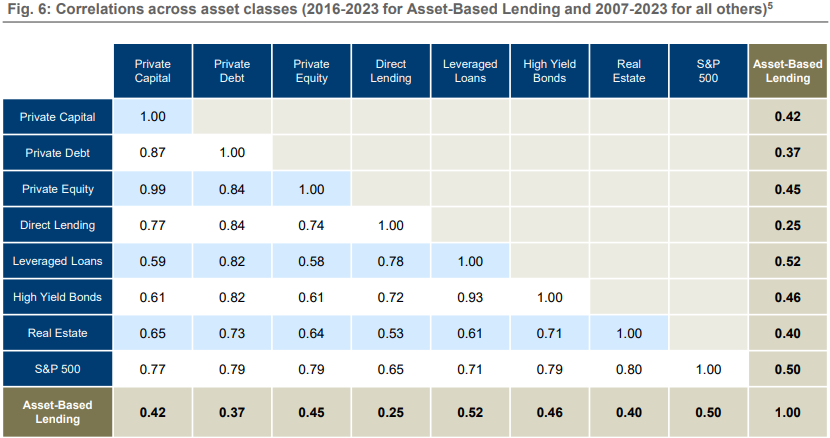
Asset-Based Lending may provide a strong source of diversification within a portfolio of private credit or within a multi-asset portfolio spanning public and private markets more broadly due to relatively low historical correlations with other asset classes.
Private Asset-Based Lending has had historically lower correlations with other asset classes.
Investors in asset-based transactions may benefit from natural diversification arising from the high number of underlying loans that typically go into the SPVs. In public markets, investors may or may not have full access to loan-level data. However, in private markets, investors usually have access to more granular data which they can use to do a more robust, quantitative risk analysis. Therefore, collateral value in asset-based transactions may be more stable than collateral value in cash flow based Direct Lending.
Past performance is no guarantee of future returns. Performance returns for “Asset-Based Lending” category contained herein, and the related correlation statistics from which they were derived, were calculated by Nomura Capital Management LLC (“NCM”) for the period 2016-2023. The Asset-Based Lending category represents an internally developed and equally weighted composite of returns of certain unaffiliated Asset-Based Lending commingled vehicles (“ABL Vehicles”), sourced by NCM’s manager research team. Performance returns for the constituents of this composite were based on cashflow information obtained for each ABL Vehicle, and NCM’s calculation of each ABL Vehicle’s internal rate of return is based on such cashflow information. The constituents of the Asset-Based Lending include only those ABL Vehicles that list “Asset-Based Lending” as a primary investment strategy and from which NCM was able to obtain the cashflow information referenced herein. Neither NCM, nor any of its investment products or offerings, are included in the data set from which the Asset-Based Lending category statistics are derived.
- Private Capital, Private Debt, and Private Equity indexes sourced from Preqin, 2024. Direct Lending refers to Cliffwater Direct Lending Index. Leveraged Loans refers to Morningstar LSTA Leveraged Loan US Total Return Index. High Yield Bonds refers to Bloomberg US Corporate High Yield Total Return Index. Real Estate refers to Dow Jones REIT Total Return Index. S&P 500 refers to S&P 500 Total Return Index.
US ABS default rates refer to student loan ABS, auto ABS, nontraditional ABS, tobacco settlement ABS, credit card ABS, manufactured housing ABS, timeshare ABS, and other forms of ABS from S&P Global Ratings Research Annual Global Structured Finance Default and Rating Transition Study, 2021. Leveraged Loan default rates refers to Morningstar LSTA Leveraged Loan Index from PitchBook LCD. HY Bond default rates refer to JPM US HY bonds par-weighted LTM default rate as of June 2024.
IV. Understanding Risks of Investing in Asset-Based Lending
Sources of risk in Asset-Based Lending
Losses
We believe the biggest risk in ABL is losing value in the underlying collateral, whether driven by higher defaults or lower recoveries.
- Investors typically structure deals with strong covenants and triggers that give them more control over principal recovery. A standard structure pays investors sequentially based on payment priority while losses also tend to hit sequentially from the riskiest investor to the safest.
- In the event of severe underperformance resulting in performance trigger breaches, it is fairly common for investors to seek additional principal recovery from excess interest (i.e. the total collateral interest available after paying all expenses and debt service) which would otherwise go to the equity investor.
- Public markets are generally more standardized in terms of covenants and triggers while private markets can construct more specific ones and have a higher degree of control on the collateral and its performance.
- Many of the traditional asset classes within ABL have a plethora of loan-level historical data, which allow investors to have a better understanding of borrower behavior and to construct thoughtful scenario assumptions when projecting collateral cash flows and losses.
Duration
In ABL, investors typically price transactions to a timing curve, giving higher credit to the earliest, most predictable cash flows while putting a higher discount on the farther, least predictable cash flows.
- If borrowers slow down their payments or if the underlying loans get modified to extend maturities, then the duration of the investment may increase. To minimize extension risk, investors can negotiate modification triggers where the servicer may not extend more than a certain threshold of the portfolio.
- Other mechanisms to minimize extension risk include stating a debt principal amortization schedule, implementing weighted average life triggers, and hedging. While duration extension is not always detrimental, investors usually like to have control of when they will receive their capital back for liquidity management.
Prepayment
Prepayments refer to principal payments ahead of the predetermined schedule, which are common in ABL and usually inversely related to rates: the lower the rates, the higher the propensity for borrowers to refinance or prepay.
- Prepayments can be good or bad, based on the purchase price. If an instrument is purchased at a discount, prepayments are typically good as they realize the discount sooner than expected. Conversely, if an instrument is purchased at a premium, realizing that premium sooner than expected typically results in worse investment economics.
- Prepayments generally do not have a significant effect on the total return of instruments purchased at par other than losing the time and effort spent on analyzing that investment.
- To minimize prepayment risk, investors usually negotiate non-call protections, prepayment penalties, make-wholes, and yield supplements.
Mark-to-Market
Just like in the public equity market, prices also move in ABL (on the underlying loans as well as on the tranches of the structures). Given the lower liquidity, prices in ABL tend to be less volatile as they are usually driven by collateral performance and lower transaction volume.
- Valuation frequency on the underlying loans in ABL transactions vary from intra-day to daily/monthly/quarterly or longer. ABL tranches usually get marked monthly or quarterly.
- Because the ABL market is less liquid than public markets, transaction costs can vary significantly – typically becoming far more costly in market downturns or “risk-off” events.
Fraud
While we believe this is generally a fairly low risk, fraud and misrepresentations are still possible. Over the past decade, lenders, investors, and lawmakers have significantly reduced the incidence of fraud through tighter underwriting guidelines, stronger covenants, and help from new regulations.
Regulatory
This is usually a systemic risk specific to asset classes and generally difficult to avoid. Governments can always launch programs that affect a broad space, such as payment moratoria in student loans, principal forgiveness in mortgages, or new regulations addressing consumer asset classes.
The key to understanding the risks in any credit market is not only understanding the level of default rate and loss given defaults, but also the level of “protection” an investor has against those losses – different factors affect the degree to which an investor is insulated from loss, with the most significant considerations given to: (1) level of subordination in the capital structure, (2) how wide the tranche attachment and detachment points are, (3) how predictable and variable losses on a particular collateral type will be, (4) the loan to value ratio of the collateral, and (5) the degree to which the loans are secured – first lien (“1L”), second lien (“2L”) or unsecured.
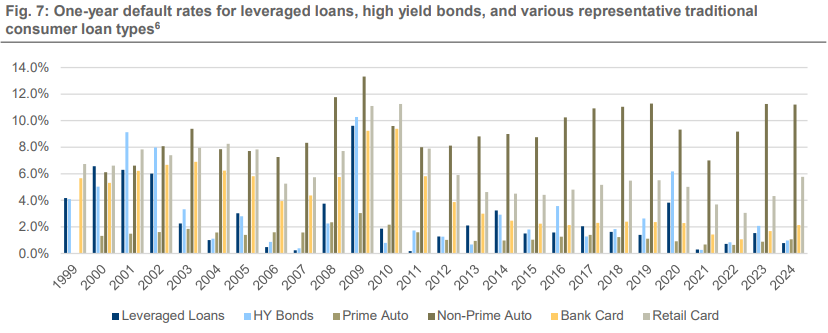
While the default rates in the Asset-Based Lending sectors shown in Figure 7 may look optically higher than in the Corporate examples of High Yield bonds or Leveraged Loans, there are two factors that we believe are mitigants to losses for investors in ABL:
- Pools of loans tend to have more statistically predictable defaults than single borrowers.
- ABL deal structures are designed with assumed default and loss assumptions based on these predictions, redirecting losses to riskier parts of the capital structure so that investors of different risk appetites can participate in the most appropriate tranche.
- Morningstar LSTA Leveraged Loan Index (last twelve months default rate by amount) from PitchBook LCD as of 8/31/2024, JPMorgan’s JPM US HY bonds par-weighted LTM default rates as of 8/31/2024, JPMorgan US ABS Research “ABS Performance Statistics” as of 9/3/2024. 2024 data corresponds to last twelve months as of 8/31/2024. Default rates for the traditional consumer loan types consist of simple trailing twelve month averages of reported default rates as tracked by JPMorgan across all available data from US public securitizations.
V. Conclusion
Asset-Based Lending is an asset class that we believe offers a strong risk reward profile, high levels of diversification, and growth in market size due to both secular shifts and more transitory trends. ABL provides financing to a wide range of sectors within the economy, and investors can gain exposure to the asset class through multiple access points across the risk spectrum. The characteristics of ABL can offer complementary portfolio construction benefits relative to traditional Corporate Middle Market Direct Lending.
These materials reflect the opinion of NCM on the date of production. Opinions and statements of financial market trends that are based on current market conditions constitute our judgement and are subject to change without notice. Past performance does not guarantee future results. Where data is presented that is prepared by third parties, such information will be cited, and these sources have been deemed to be reliable. However, NCM does not independently verify or otherwise warrant the accuracy of this information. All investments are subject to risks, including the risk of loss of principal.